|

UNITED
KINGDOM
POPULATION:
64,1
MLN
SOURCE:
SOCIETY OF
MOTOR MANUFACTURERS AND TRADERS (SMMT.CO.UK) |
|
Immatricolazioni Fiat, Alfa
Romeo, Jeep
nel REGNO UNITO
|
|
Registrations Fiat, Alfa Romeo,
Jeep in
UNITED KINGDOM
|
|
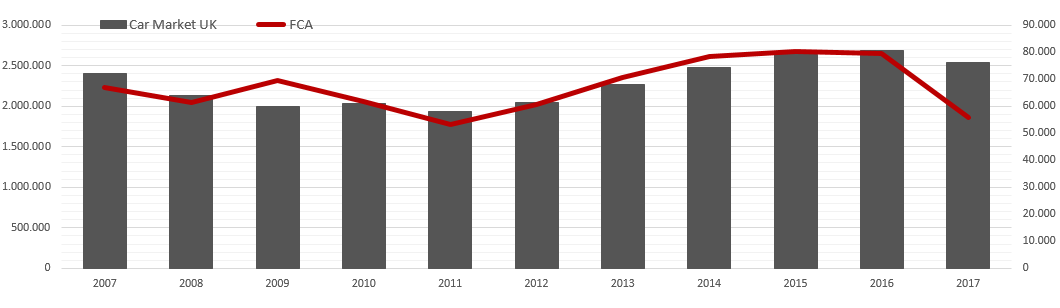
Le
vendite di auto nuove sono risultate in calo del 5,7% nel 2017 nel Regno
Unito, le immatricolazioni sono state pari a 2.540.617 unità, superando
i livelli pre-recessione.
Tra i
costruttori, il marchio leader nel 2017 è stato Ford (287.396 auto
vendute -9,7%) seguito da Volkswagen, Vauxhall, Mercedes Benz e Bmw.
Il
Gruppo Fiat Chrysler è cresciuto nel Regno Unito l'anno scorso con il
solo marchio Alfa Romeo che ha messo a segno un +2,4% a 4.997 vetture
immatricolate. Fiat è risultata in calo del 26,6% a 44.475 auto vendute
mentre Jeep ha perso il 54,7%.
Buona
crescita nel 2017 per i marchi Abarth e Maserati nel Regno Unito,
rispettivamente +12 e +18,5%.
|
|
Sales of new cars was down by 5.7% in 2017
in the UK, registrations totaled 2,540,617 units, surpassing the
pre-recession levels.
Among the manufacturers, the leading brand
in 2017 was Ford (287,396 cars sold -9.7%) followed by Volkswagen,
Vauxhall, Mercedes Benz and Bmw.
The Fiat Chrysler Group has grown in the
United Kingdom last year with only the Alfa Romeo brand that has posted
a +2,4% to 4,997 vehicles sold. Fiat was down 26.6% to 44,475 cars sold,
while Jeep has lost 54.7%.
Good growth in 2017 for the Abarth and
Maserati brands in the United Kingdom, respectively +12 and + 18.5%. |