|

RUSSIA
POPULATION:
146,1
MLN
SOURCE:
ASSOCIATION
OF EUROPEAN BUSINESSES IN THE RUSSIAN FEDERATION
(AEBRUS.RU) |
|
Immatricolazioni Fiat, Jeep in
RUSSIA
|
|
Registrations Fiat, Jeep in
RUSSIA
|
|
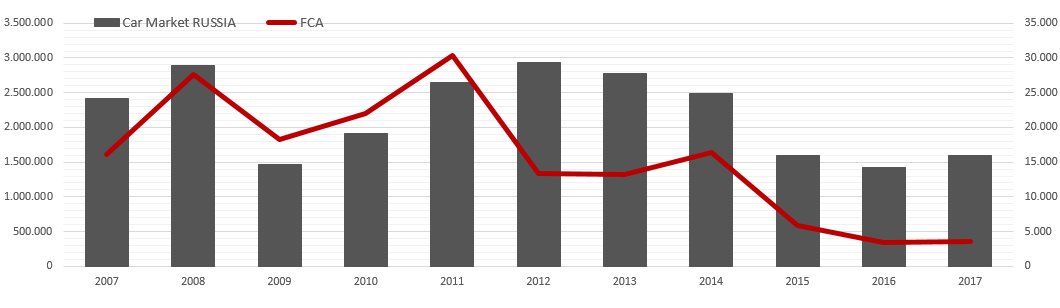
Il 2017 ha
visto il primo rialzo dopo anni di perdite per le vendite di auto russe;
le immatricolazioni sono cresciute dell'11,9% a 1.595.737 unità.
Lada ha
dominato il mercato russo anche nel 2017 con 311.588 vetture
immatricolate, davanti a Kia, Hyundai, Renault e Toyota.
Il
Gruppo FCA ha perso molto in Russia negli anni precedenti e nel 2017
la quota di mercato si è abbassata ancora allo 0,23%. Fiat ha
totalizzato 2.323 immatricolazioni (+7,6%) mentre Jeep con 1.274
auto vendute è rimasta stabile sul 2016.
Anche nel
2017 il Fiat Ducato è stato il modello del Gruppo FCA più venduto in
Russia, davanti ai modelli Jeep. |
|
2017 saw
the first rise after years of losses for Russian car sales;
registrations increased by 11.9% to 1,595,737 units.
Lada led
the Russian market also in 2017 with 311,588 vehicles sold, ahead of
Kia, Hyundai, Renault and Toyota.
The Fiat
Chrysler Automobiles Group lost a lot in Russia in previous years and in
2017 the market share fell again to 0.23%. Fiat totaled 2,323
registrations (+ 7.6%) while Jeep with 1,274 cars sold remained stable
compared to 2016.
Also in
2017, the Fiat Ducato has been the FCA Group's top selling model in
Russia, in front of Jeep models.
|