FIAT - CHRYSLER  CAR SALES STATISTICS


HOME

CHARTS

WORLD SALES CAR MODELS MASERATI FERRARI SOURCES
     
  ITA FRA GER ESP GBR EUR BRA RUS _IND_ CHN AUS TUR MEX ARG JPN USA CAN    

INDIA

POPULATION: 1.247,6 MLN

SOURCE:
THE INDIAN AUTOMOTIVE SCENE (TEAM-BHP.COM)


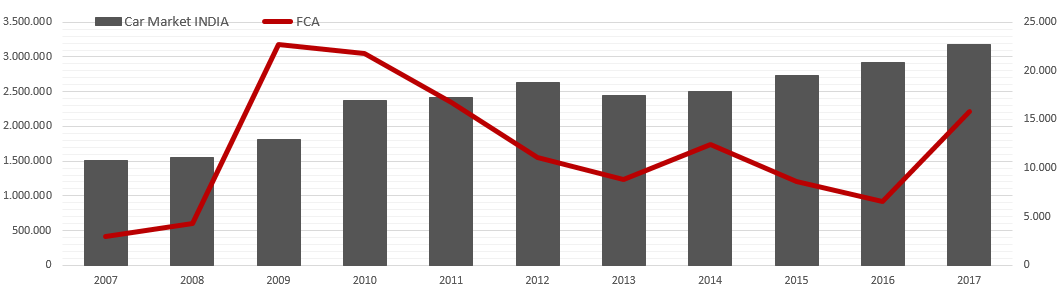
Immatricolazioni Fiat in INDIA


Questa pagina riporta le statistiche di vendita del Gruppo Fiat Chrysler Automobiles in India negli anni 2013-2014-2015. Puoi analizzare le quote di mercato, i grafici e le tendenze, i risultati dei principali concorrenti del Gruppo FCA e l'andamento del mercato auto del Paese.


Registrations Fiat in INDIA


This page shows the sales statistics of the Fiat Chrysler Automobiles Group in India for the years 2013-2014-2015. You can analyze market shares, graphs and trends, the results of the main competitors of the FCA Group and the performance of the country's car market.


Mercato Auto India  2015  India Car Market


2.728.306

8,8%

 
MARUTI-SUZUKI HYUNDAI MAHINDRA HONDA TATA
1.289.128 +12% 476.001 +16% 206.825 -1% 202.390 +13% 139.906 +10%
TOYOTA FORD RENAULT VOLKSWAGEN CHEVROLET
139.816 +5% 77.809 +1% 53.418 +19% 43.156 -2% 36.518 -37%

2015

  JAN FEB MAR APR MAY JUN JUL AUG SEP OCT NOV DEC  

TOTAL

MARKET

  +7,0% +7,0% +3,6%  

+5,6%

+0,5%   +4,7% +4,7%        

CHARTS

      +16,9%     +12,9%       +11,8% +10,6%
                  +22,1%    


market share :

0,40 0,26 0,31 0,32 0,34 0,35 0,39 0,29 0,24 0,29 0,26 0,35   0,32

FIAT

912 591 751 680 737 757 849 642 539 764 606 792   8.620

% on 2014 :

-34,2% -54,6% -50,0% -17,9% -7,9% -5,5% 18,2% -42,9% -46,4% -44,2% -20,3% -1,4%   30,5%

FIAT PUNTO EVO + AVVENTURA FIAT LINEA
6.763   -27,9% 1.857   -38,4%


Mercato Auto India  2014  India Car Market


2.507.498

2,8%


MARUTI-SUZUKI HYUNDAI MAHINDRA HONDA TOYOTA
1.152.123 +8% 411.456 +8% 208.067 -14% 179.783 +67% 132.748 -9%
TATA FORD CHEVROLET RENAULT VOLKSWAGEN
127.118 -11% 77.157 -4% 57.565 -34% 44.793 -30% 44.209 -27%

2014

  JAN FEB MAR APR MAY JUN JUL AUG SEP OCT NOV DEC  

TOTAL

MARKET

  -7,8% -0,7% -5,2% -8,2%

+4,7%

  +9,6%   +5,5% -5,3% +6,5%    

CHARTS

          +13,4%   +15,5%       +14,0%


market share :

0,65 0,61 0,65 0,45 0,40 0,38 0,37 0,54 0,46 0,63 0,36 0,39   0,49

FIAT

1.385 1.302 1.503 828 800 801 718 1.124 1.005 1.368 760 803   12.397

% on 2013 :

299,1% 544,6% 225,3% 111,8% 29,0% 3,4% -22,6% 12,1% -7,5% 12,9% -24,4% 4,3%   40,9%

FIAT PUNTO + EVO FIAT LINEA
9.380   +45,9% 3.017   +27,3%


Mercato Auto India  2013  India Car Market


2.439.551

7,2%


MARUTI-SUZUKI HYUNDAI MAHINDRA TOYOTA TATA
1.063.964 +0% 380.002 -3% 242.405 -7% 145.132 -16% 142.045 -51%
HONDA CHEVROLET FORD RENAULT VOLKSWAGEN
107.658 +47% 86.825 -6% 80.431 -8% 64.368 +83% 60.405 -10%

2013

  JAN FEB MAR APR MAY JUN JUL AUG SEP OCT NOV DEC  

TOTAL

MARKET

  -5,2%     -8,7%

-9,2%

-5,2% -8,1% +5,4% -3,5% -1,1% -7,9% -5,8%  

CHARTS

  -17,6% -13,5%                  


market share :

0,15 0,09 0,19 0,20 0,32 0,41 0,52 0,55 0,52 0,53 0,51 0,43   0,36

FIAT

347 202 462 391 620 775 928 1.003 1.086 1.212 1.005 770   8.801

% on 2012 :

-83,5% -88,1% -67,3% -60,9% -38,1% -3,7% 20,5% 113,4% 65,5% 113,4% 272,2% 108,7%   20,9%

FIAT GRANDE PUNTO FIAT LINEA
6.430   -26,7% 2.371   -8,3%


 >  Vendite Auto FCA in India
2012-2011-2010

 >  FCA Auto sales in India
2012-2011-2010